
The tic-tac-toe solution space
- Poster
- 27 × 38 in
- 2019
Traditionally, much of what designers have been called upon to do revolves around giving form to artifacts—a thin veneer on top of existing products and services.
Advancements in computing and AI are now fundamentally changing design practice. These changes have significant implications for design education and continuing education. For example, it seems clear that designers will need to become familiar with programming, using data, and doing analysis to discover and visualize patterns and relationships. Like many aspects of modern society, design practice is becoming data-driven, too.
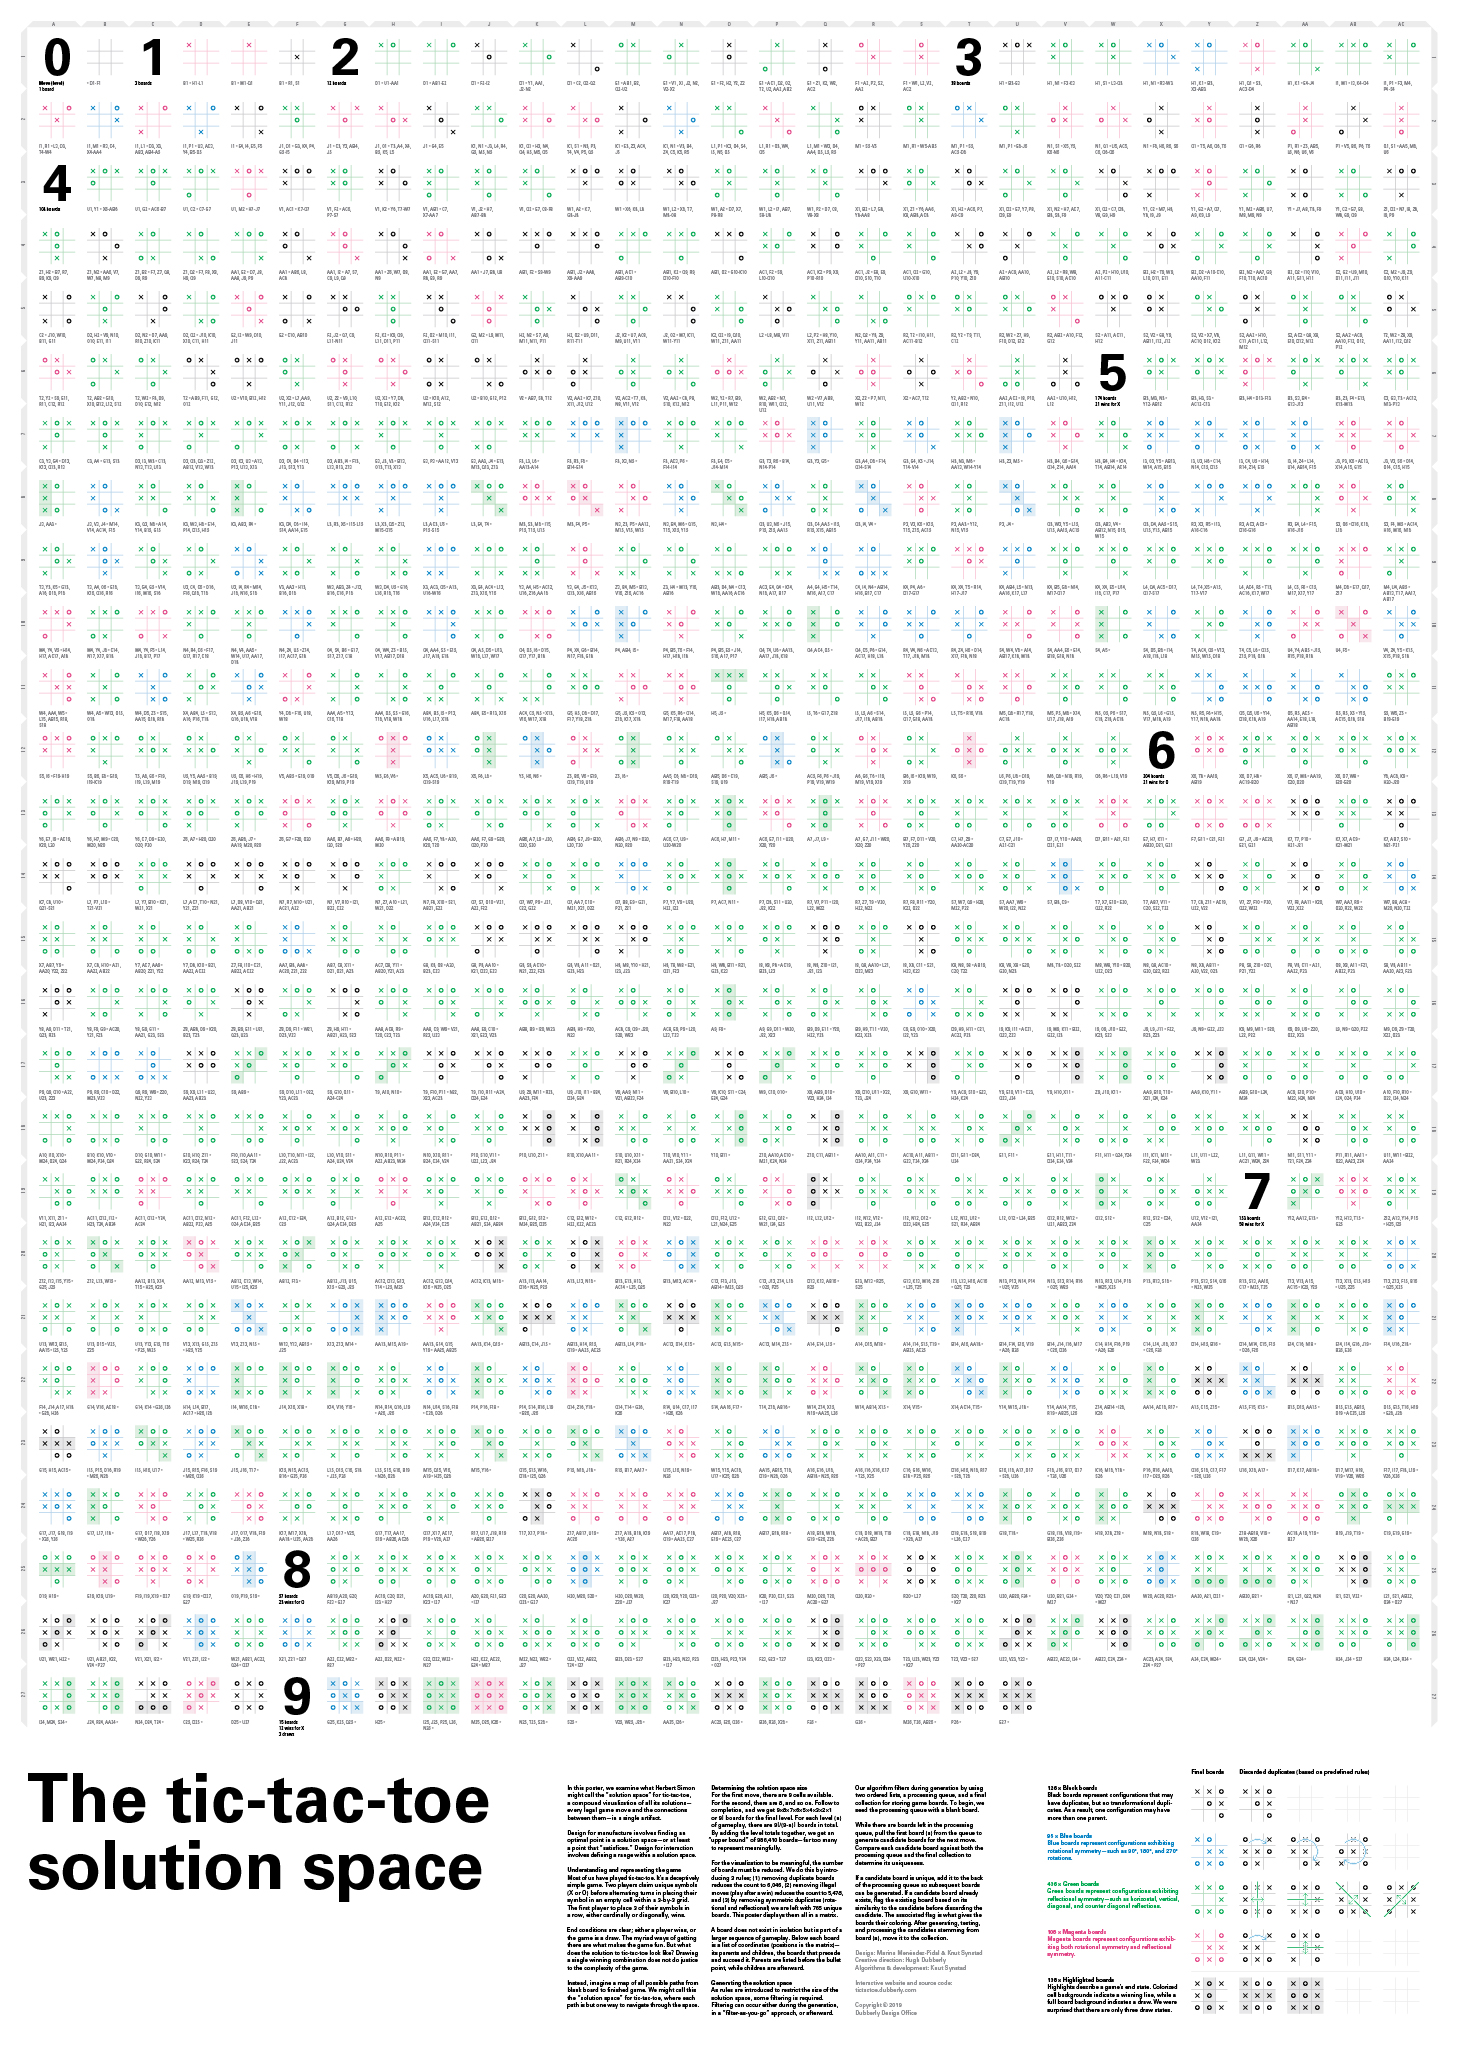
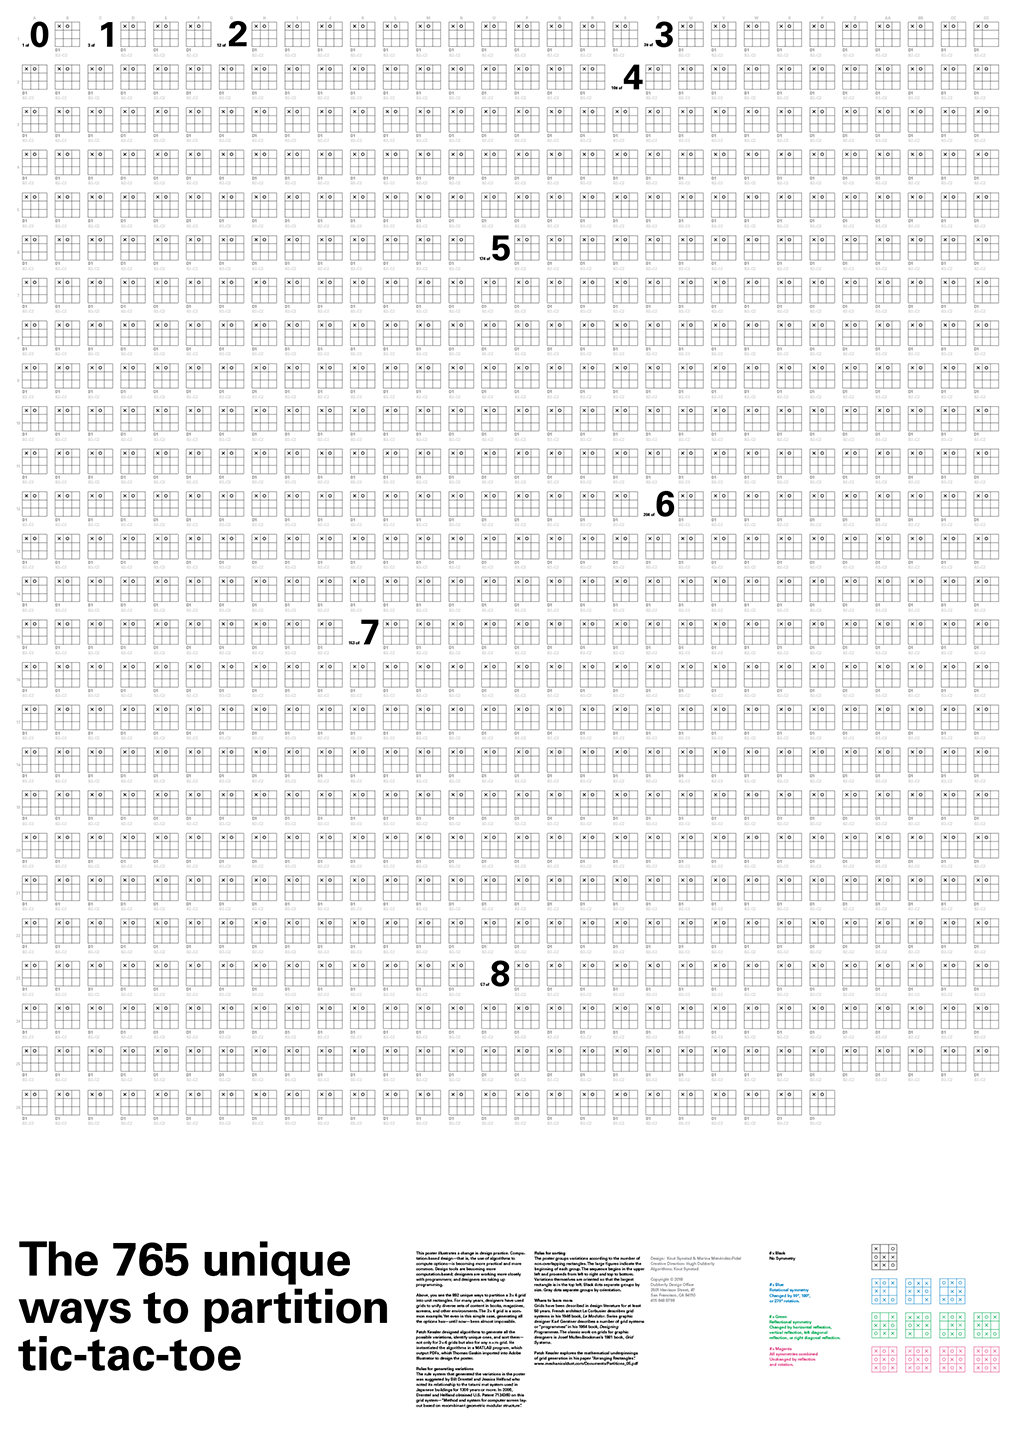
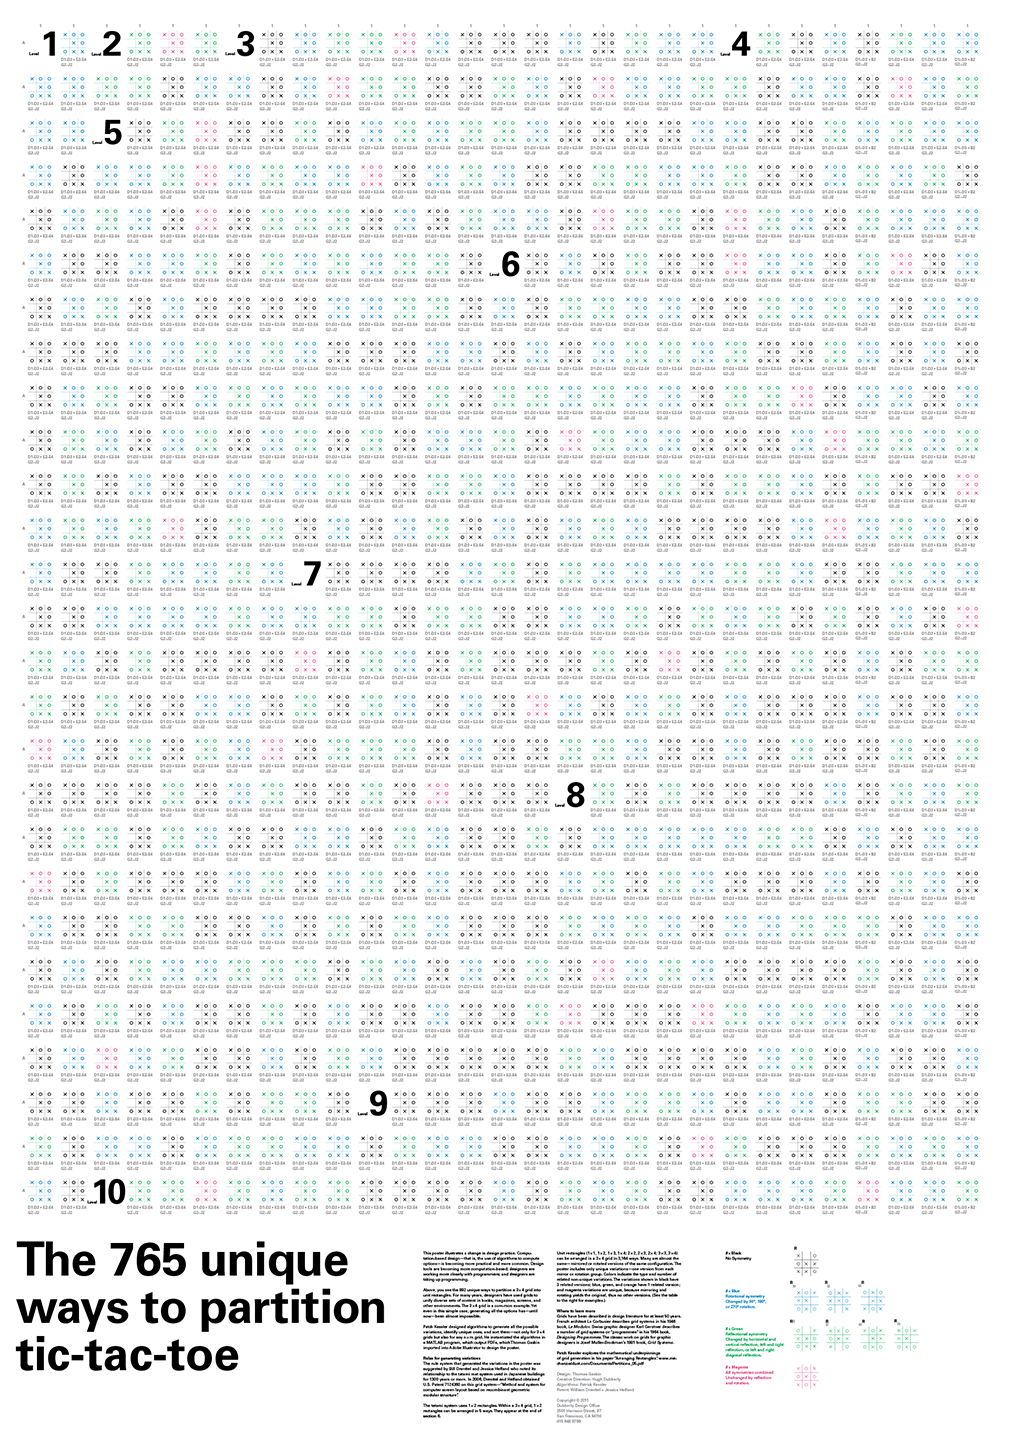
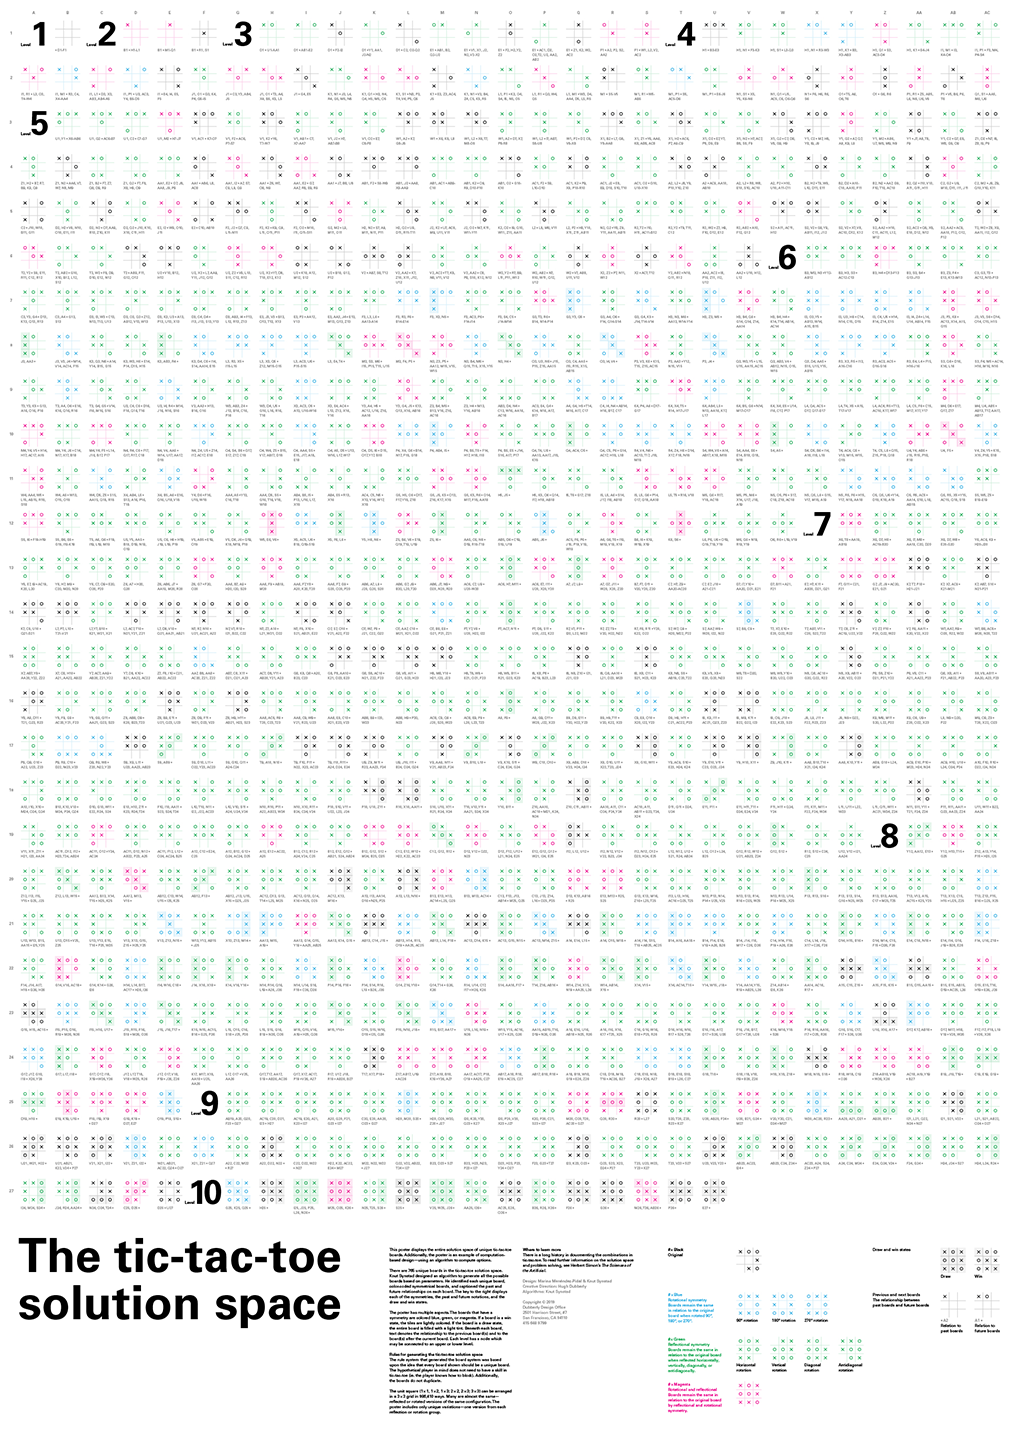
In this poster, we examine what Herbert Simon might call the “solution space” for tic-tac-toe, a compound visualization of all its solutions— every legal game move and the connections between them in a single artifact.
Most of us have played tic-tac-toe at some point or another in our lives. It’s a deceptively simple game. Two players claim unique symbols (X or O) before taking alternating turns in placing that symbol in an available cell within a 3-by-3 grid. The first player to get their 3 symbols in a row, either cardinally or diagonally, wins.
End conditions are clear; either a player wins or the game is a draw. The myriad of ways of getting there is what makes the game fun. But what does the solution to tic-tac-toe look like? Drawing a single winning combination does not do justice to the complexity of the game.
Instead, imagine a map of all possible paths from blank board to finished game. We might call this the “solution space” for tic-tac-toe, where each path is but one way to navigate through it.
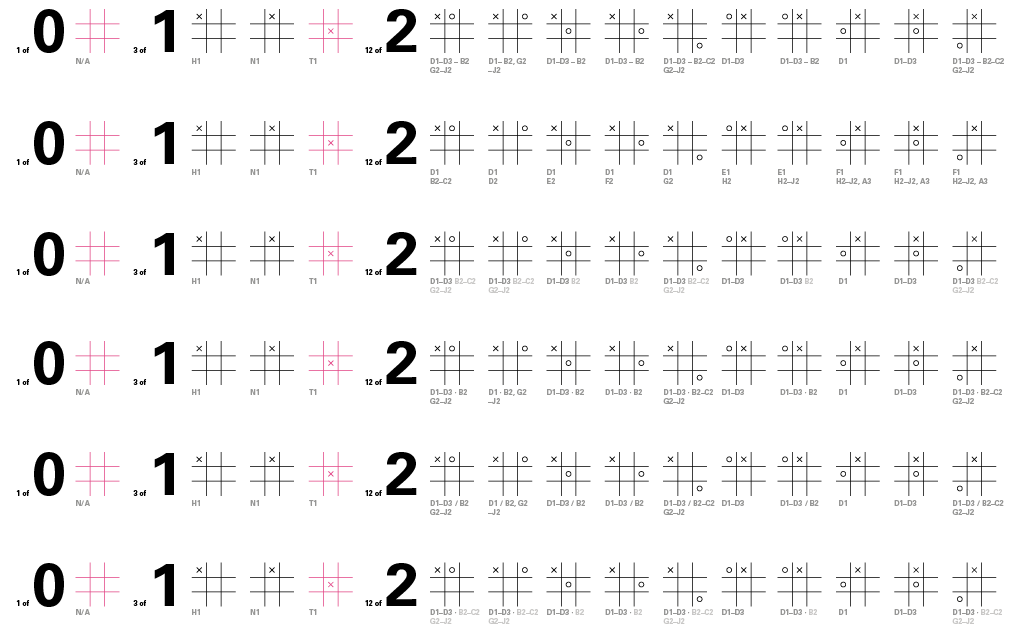
For the first move, there are 9 cells available. For the second, there are 8, and so on. Follow this to completion and we get 9×8×7×6×5×4×3×2×1 or 9! boards. For each level (n) of gameplay, there are 9!/(9-n)! combinations. By adding the level totals together, we get an “upper bound” of 986,410 boards—far too many to represent meaningfully.
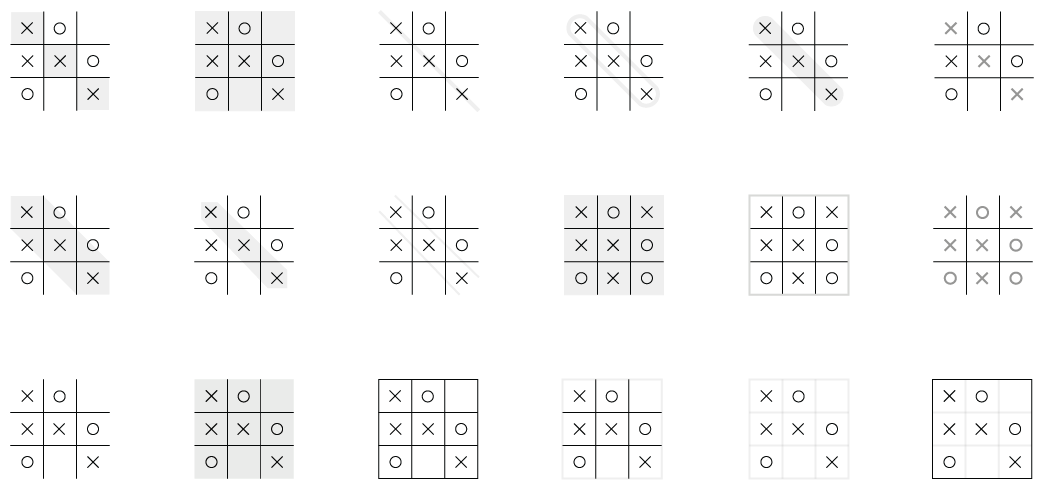
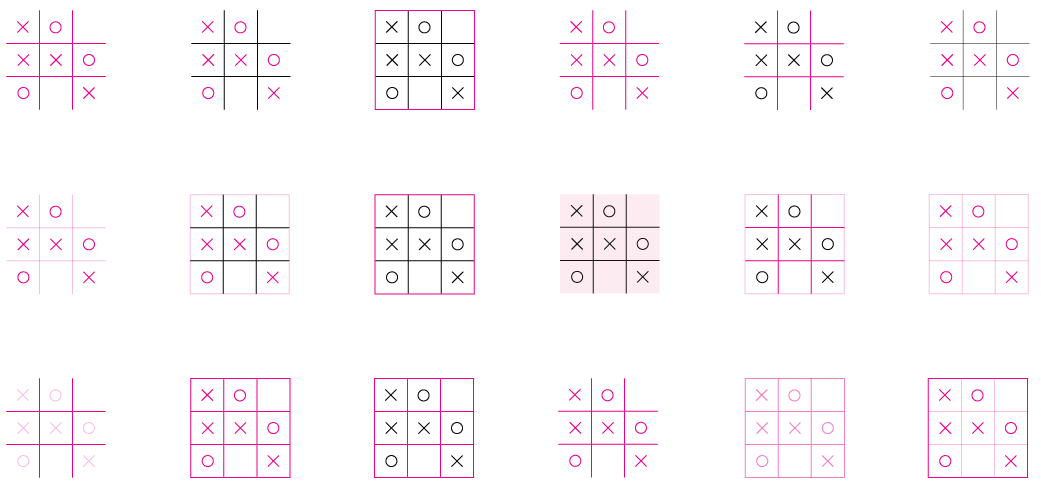
For the visualization to be meaningful, we need to greatly reduce the number of boards. We do this by introducing 3 rules; (1) removing duplicate boards reduces the count to 6,046, (2) removing illegal moves reduces the count to 5,478, and (3) by removing symmetric duplicates (rotational and reflectional) we are left with 765 unique boards. This poster displays them all in a matrix.
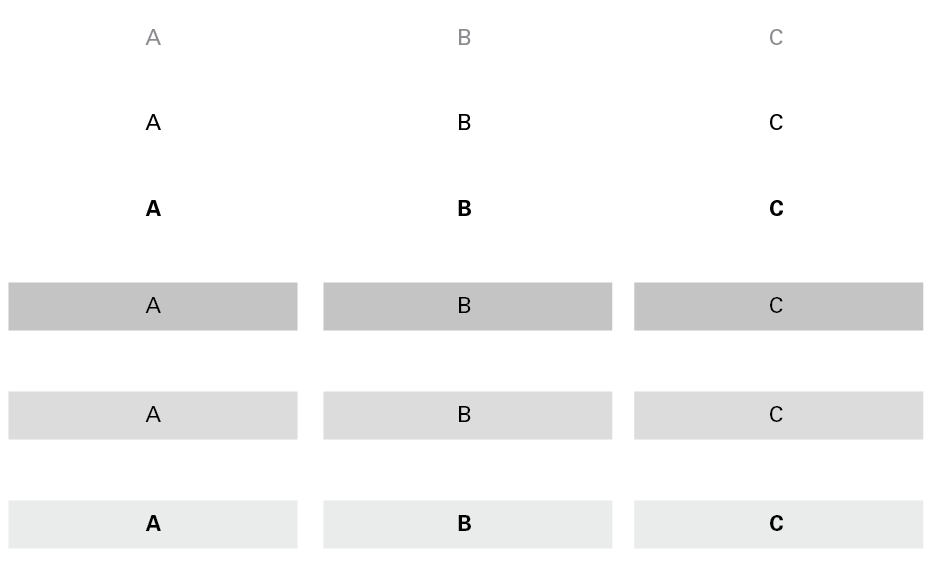
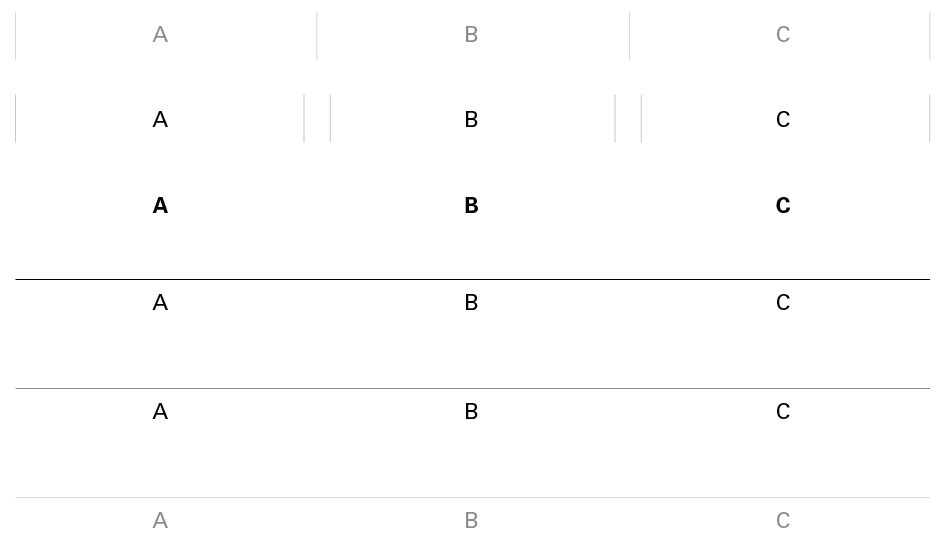
A board does not exist in isolation but is part of a larger sequence of gameplay. Below each board is a list of coordinates—its parents and children, the boards that precede and succeed it. Parents are listed before the bullet point, while children are afterward.
The underlying dataset was created using two ordered lists, a processing queue, and a collection. We begin by seeding the queue with a blank board. While there are still boards in the queue, do the following: Pull the first board (a) from the queue before generating new boards for all possible combinations for the next step. Compare the new boards against both the queue and the collection to see if it already exists. If it does not exist, add it to the queue, and if it does exist, discard it. Board A is then moved to the collection.
- Design:
- Marina Menéndez-Pidal and Knut Synstad
- Creative direction:
- Hugh Dubberly
- Algorithms:
- Knut Synstad
Related to
- The tic-tac-toe solution space, website