


The tic-tac-toe solution space
- Website
- 2019
In this visualization, we examine what Herbert Simon might call the “solution space” for tic-tac-toe, a compound visualization of all its solutions—every legal game move and the connections between them—in a single artifact.
Design for manufacture involves finding an optimal point in a solution space—or at least a point that “satisfices.” Design for interaction involves defining a range within a solution space.
Most of us have played tic-tac-toe. It's a deceptively simple game. Two players claim unique symbols (X or O) before alternating turns in placing their symbol in an empty cell within a 3-by-3 grid. The first player to place 3 of their symbols in a row, either cardinally or diagonally, wins.
End conditions are clear; either a player wins, or the game is a draw. The myriad ways of getting there are what makes the game fun. But what does the solution to tic-tac-toe look like? Drawing a single winning combination does not do justice to the complexity of the game.
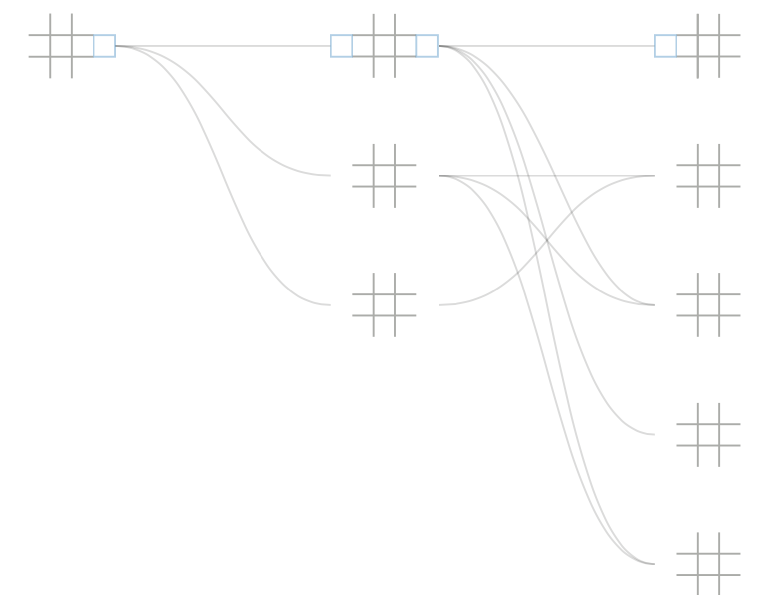
Instead, imagine a map of all possible paths from blank board to finished game. We might call this the “solution space” for tic-tac-toe, where each path is but one way to navigate through the space.
For the first move, there are 9 cells available. For the second, there are 8, and so on. Follow to completion, and we get 9×8×7×6×5×4×3×2×1 or 9! boards for the final level. For each level n of gameplay, there are 9!/(9-n)! boards in total. By adding the level totals together, we get an “upper bound” of 986,410 boards—far too many to represent meaningfully.
For the visualization to be meaningful, the number of boards must be reduced. We do this by introducing 3 rules; (1) removing duplicate boards reduces the count to 6,046, (2) removing illegal moves (play after a win) reduces the count to 5,478, and (3) by removing symmetric duplicates (rotational and reflectional) we are left with 765 unique boards. This poster displays them all in a matrix.
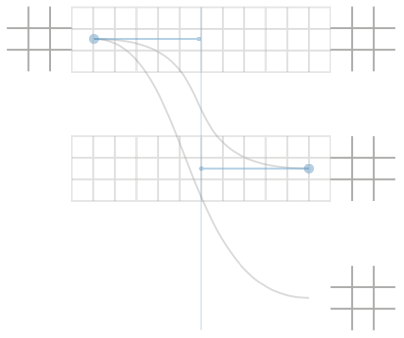
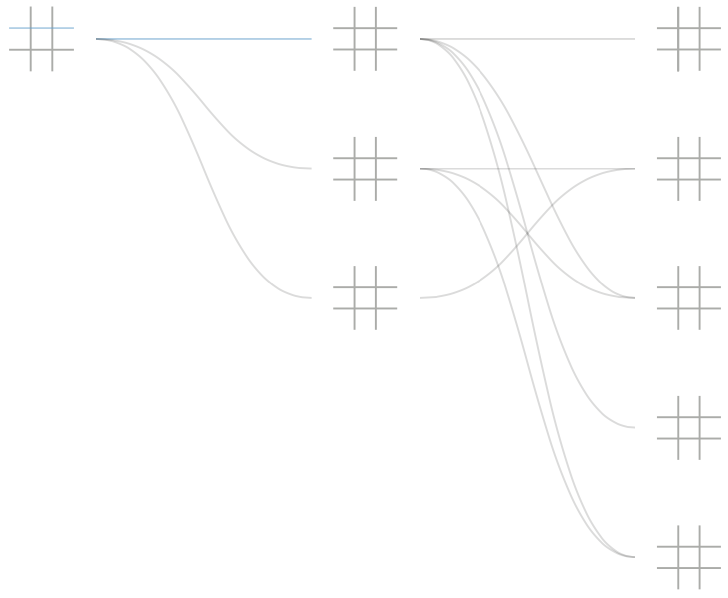
A board does not exist in isolation but is part of a larger sequence of gameplay. Below each board is a list of coordinates (positions in the matrix)—its parents and children, the boards that precede and succeed it. Parents are listed before the bullet point, while children are afterward.
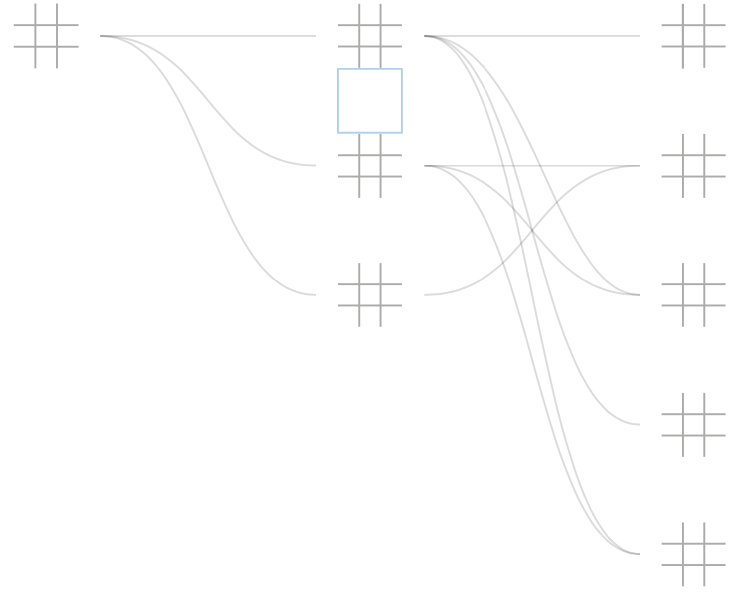
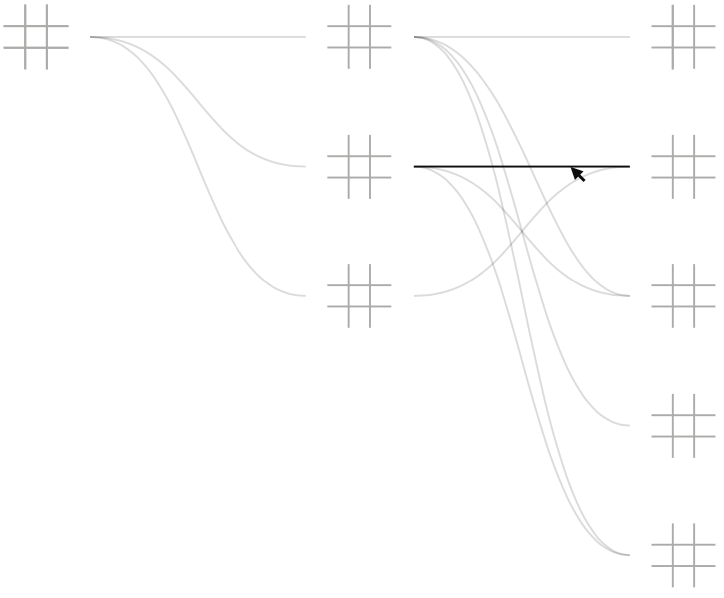
As rules are introduced to restrict the size of the solution space, some filtering is required. Filtering can occur either during the generation, in a “filter-as-you-go” approach, or afterward. Our algorithm filters during generation by using two ordered lists, a processing queue, and a final collection for storing game boards. To begin, we seed the processing queue with a blank board.
While there are boards left in the processing queue, pull the first board a from the queue to generate candidate boards for the next move. Compare each candidate board against both the processing queue and the final collection to determine its uniqueness.
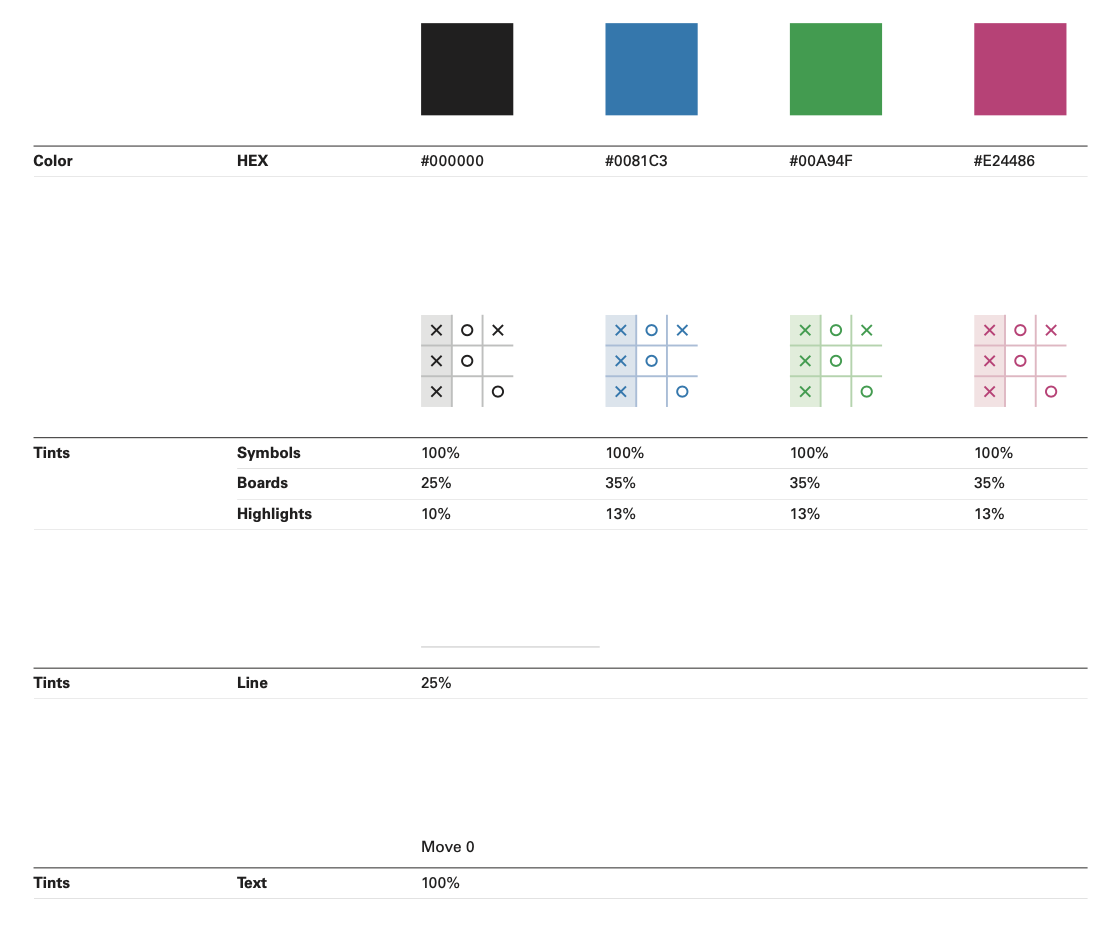
If a candidate board is unique, add it to the back of the processing queue so subsequent boards can be generated. If a candidate board already exists, flag the existing board based on its similarity to the candidate before discarding the candidate. The associated flag is what gives the boards their coloring. After generating, testing, and processing the candidates stemming from board a, move it to the collection.
- Design:
- Marina Menéndez-Pidal and Knut Synstad
- Creative direction:
- Hugh Dubberly
- Algorithms:
- Knut Synstad
Presented in
- The tic-tac-toe solution space interactive website, Dubberly Design Office
Related to
- The tic-tac-toe solution space, poster